What Domestic Travelers Actually Did During the 2026 FIFA World Cup
Everyone measured the World Cup's international wave. Here's the half of the ledger nobody counted.

Welcome to part 1 of Arrivalist’s 5-part series on the domestic impact of the 2026 FIFA World Cup matches in the US.
Two stories emerged from the World Cup’s 39 days in America, and they can’t both be entirely right. Bank of America says the tournament injected $20 billion into the US economy. Hotel data from CoStar says host cities sold 1.1 percent fewer room nights than a year earlier and overseas arrivals declined, even as record rates pushed RevPAR up 16.7 percent. Between those headlines sits a question nobody has answered: what did domestic travelers do?
Arrivalist’s SpendInsights platform, built on in-person transactions by tens of millions of American cardholders, can answer it, in every host city, every day, through the final. We compared the tournament window (June 11 to July 19) to the six weeks before it, benchmarked against the same seasonal pattern in 2025, and excluded event-ticket merchants so the numbers reflect on-the-ground spending: restaurants, bars, retail, transit, attractions.
The topline: not one host metro lost domestic visitor spending. Every one of the twelve host-market geographies we measured came in at or above its seasonal norm, from Philadelphia at +15 percent to Seattle and Boston at +4 percent (all figures estimated). Despite the soft hotel room demand, domestic travelers did not abandon the host cities.
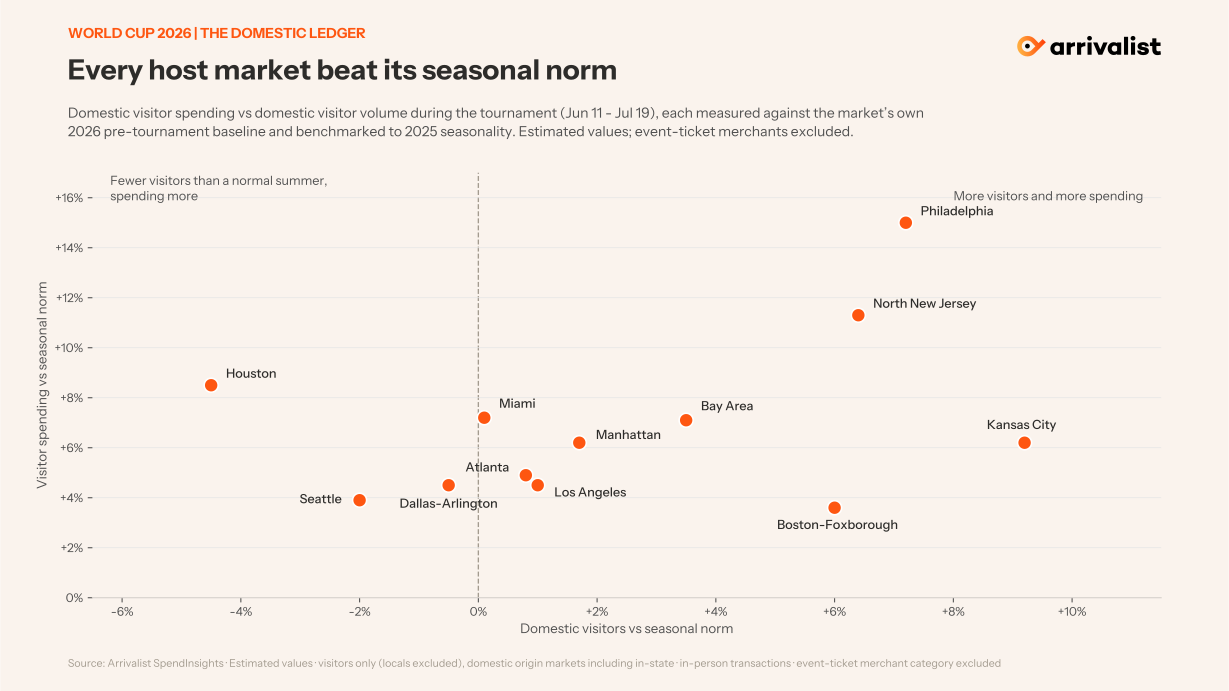
But look across the chart from left to right and the more interesting story appears: the cities split into two tournaments. Kansas City, Philadelphia, Boston, and the New Jersey stadium corridor (East Rutherford, Newark, Jersey City, Hoboken, etc) drew more American visitors than a normal summer. Seattle, Houston, and Dallas drew slightly fewer people who spent more, a fewer-but-busier pattern: their average purchase didn’t get bigger, they simply transacted more. Houston is the sharpest example. Its hoteliers spent June under “underdelivered” headlines, and sure enough, 4 percent fewer domestic visitors came than a normal summer would bring. But they spent 9 percent more. The volume complaint and the spending gain are both true, and it takes transaction-level data to see them at once.
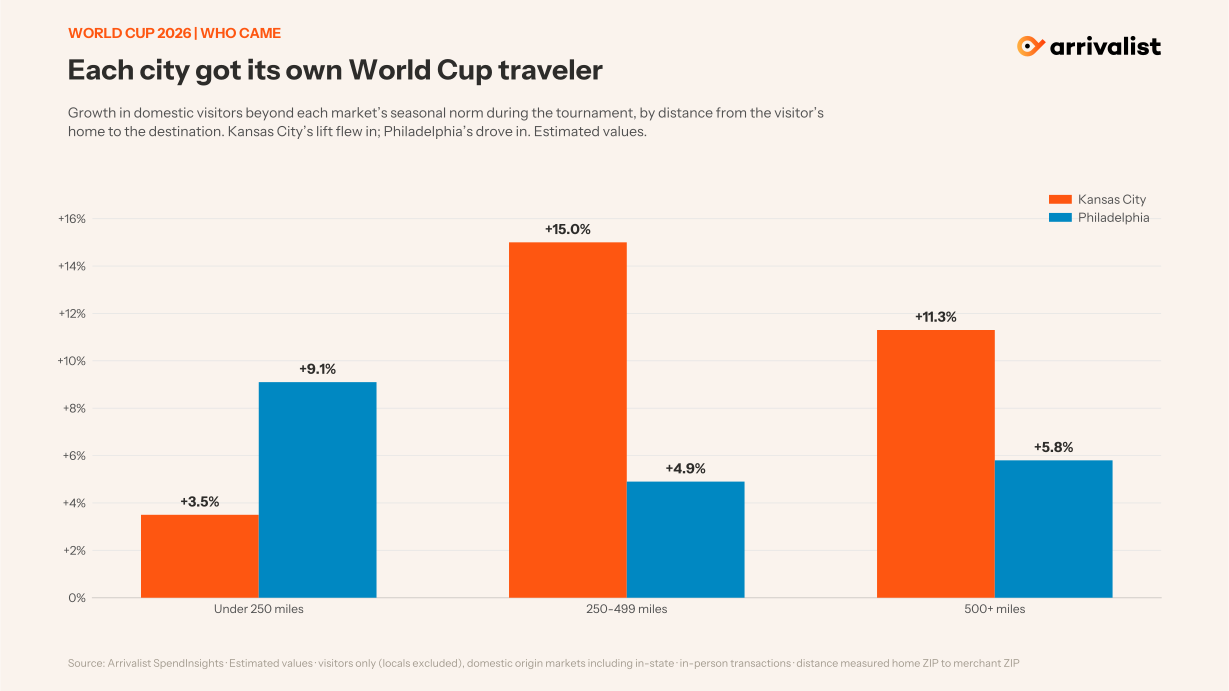
Who showed up also varied city by city. In Kansas City, visitors from within 250 miles held at seasonal norm while travelers from 250-plus miles ran 10 to 15 percent above it; the incremental visitor flew in. Philadelphia was the opposite: its regional drive market grew fastest. There was no single national World Cup traveler. Each city got its own.
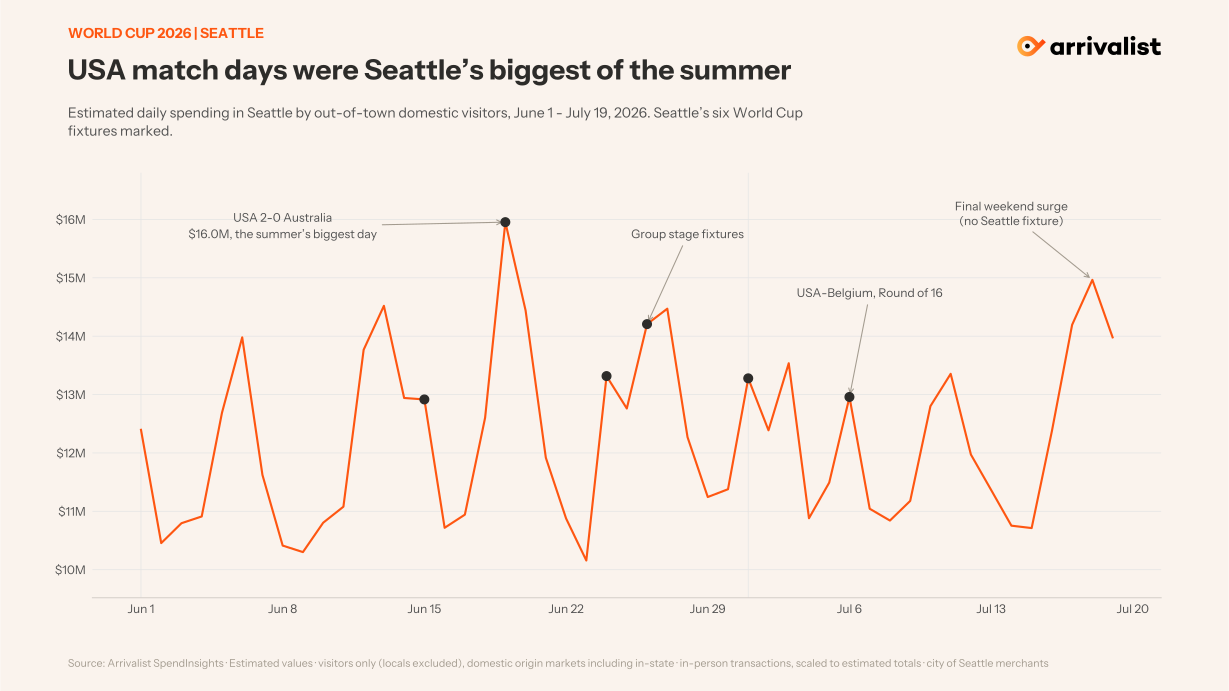
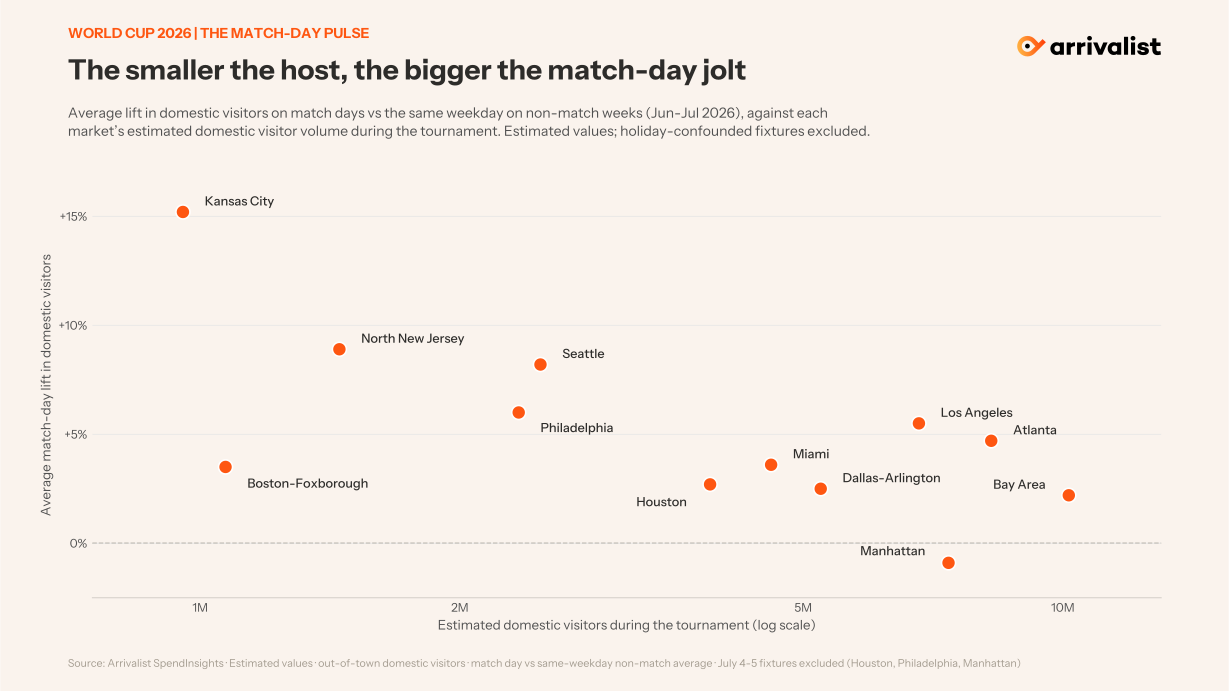
What the cities did not share equally was the match-day pulse: it scaled inversely with the size of the host. Kansas City’s fixture days averaged 15 percent more domestic visitors than comparable non-match days, peaking at 21 percent for Argentina’s opener, and Seattle’s ran 6 to 11 percent, with USA-Australia the biggest visitor-spend day of its summer. The mega-markets barely flinched: match days added 1 to 3 percent on average in Dallas, Houston, and the Bay Area, and Manhattan was actually down slightly. Only the biggest occasions cut through everywhere. On final Sunday, the towns around MetLife Stadium drew 20 percent more American visitors, spending 31 percent more, than a typical July Sunday.
Where the money went is a story for a later piece in this series, but the national shape is already clear. Across all twelve host markets combined, visitor spending at bars ran about 12 percent beyond its seasonal norm, quick service and sit-down dining each ran about 8 percent beyond theirs, and parking trailed. The sleeper was groceries: visitor grocery spending beat its norm in every single host market, the signature of fans provisioning rented homes for a long stay.
Host committees will publish their impact studies this fall. The domestic ledger is already legible, and it says the World Cup didn’t empty America’s host cities. It changed who was in them.
────────────────
Methodology note: Figures are estimates from Arrivalist SpendInsights, based on in-person transactions by US-issued credit and debit cards observed at merchants in each host market and scaled to represent total domestic visitor activity. “Seasonal norm” compares June 11 – July 19, 2026 against May 1 – June 10, 2026, indexed to the same ratio across identical 2025 dates. Event-ticket merchant categories are excluded. Lodging and airfare are predominantly booked online and are outside the scope of this analysis.